1
Department of Naval Architecture, Ocean and Marine Engineering, University of Strathclyde, the United Kingdom
2
Department of Civil, Maritime and Environmental Engineering, University of Southampton, the United Kingdom
Abstract
In ship hydrodynamics, hull surface roughness modifies near-wall turbulence and boundary-layer development,
thereby influencing resistance along the hull. In most resistance prediction methodologies, these effects are
represented using an equivalent uniform roughness height. In practice, however, ship hulls exhibit non-uniform
roughness distributions due to biofouling development and coating degradation. The hydrodynamic implications
of this spatial variability are not yet fully understood.
This study presents a systematic computational fluid dynamics (CFD) investigation of spatially distributed hull
roughness effects on ship resistance. Two benchmark hull forms—the KRISO Container Ship (KCS) and the KRISO
Very Large Crude Carrier 2 (KVLCC2)—are analysed. Ten idealised roughness distributions are considered,
including uniform, linear, non-linear, stochastic, and shear stress-based configurations. All cases are
constructed to preserve a reference-equivalent roughness severity, such that only the influence of spatial
roughness distribution is isolated.
The results show that, under identical reference-equivalent roughness severity, measurable differences in the
total resistance coefficient CT arise when only the spatial distribution of hull roughness is
varied. The resulting variations in CT between idealised roughness distributions are more
pronounced for the fuller KVLCC2 hull form. Flow-field analysis indicates that these variations in
CT are associated with cumulative boundary-layer development and wake recovery, with a strong
sensitivity to roughness placement in the lower hull region. The findings suggest that the spatial distribution
of hull roughness plays a key role in governing boundary-layer development and the resulting resistance response,
even when the overall roughness severity is unchanged. Explicit consideration of roughness distribution therefore
provides a more physically consistent basis for interpreting roughness-induced resistance effects.
Conference paper (2026)
36th Symposium on Naval Hydrodynamics (SNH36)
Proceedings forthcoming
Selected Figures
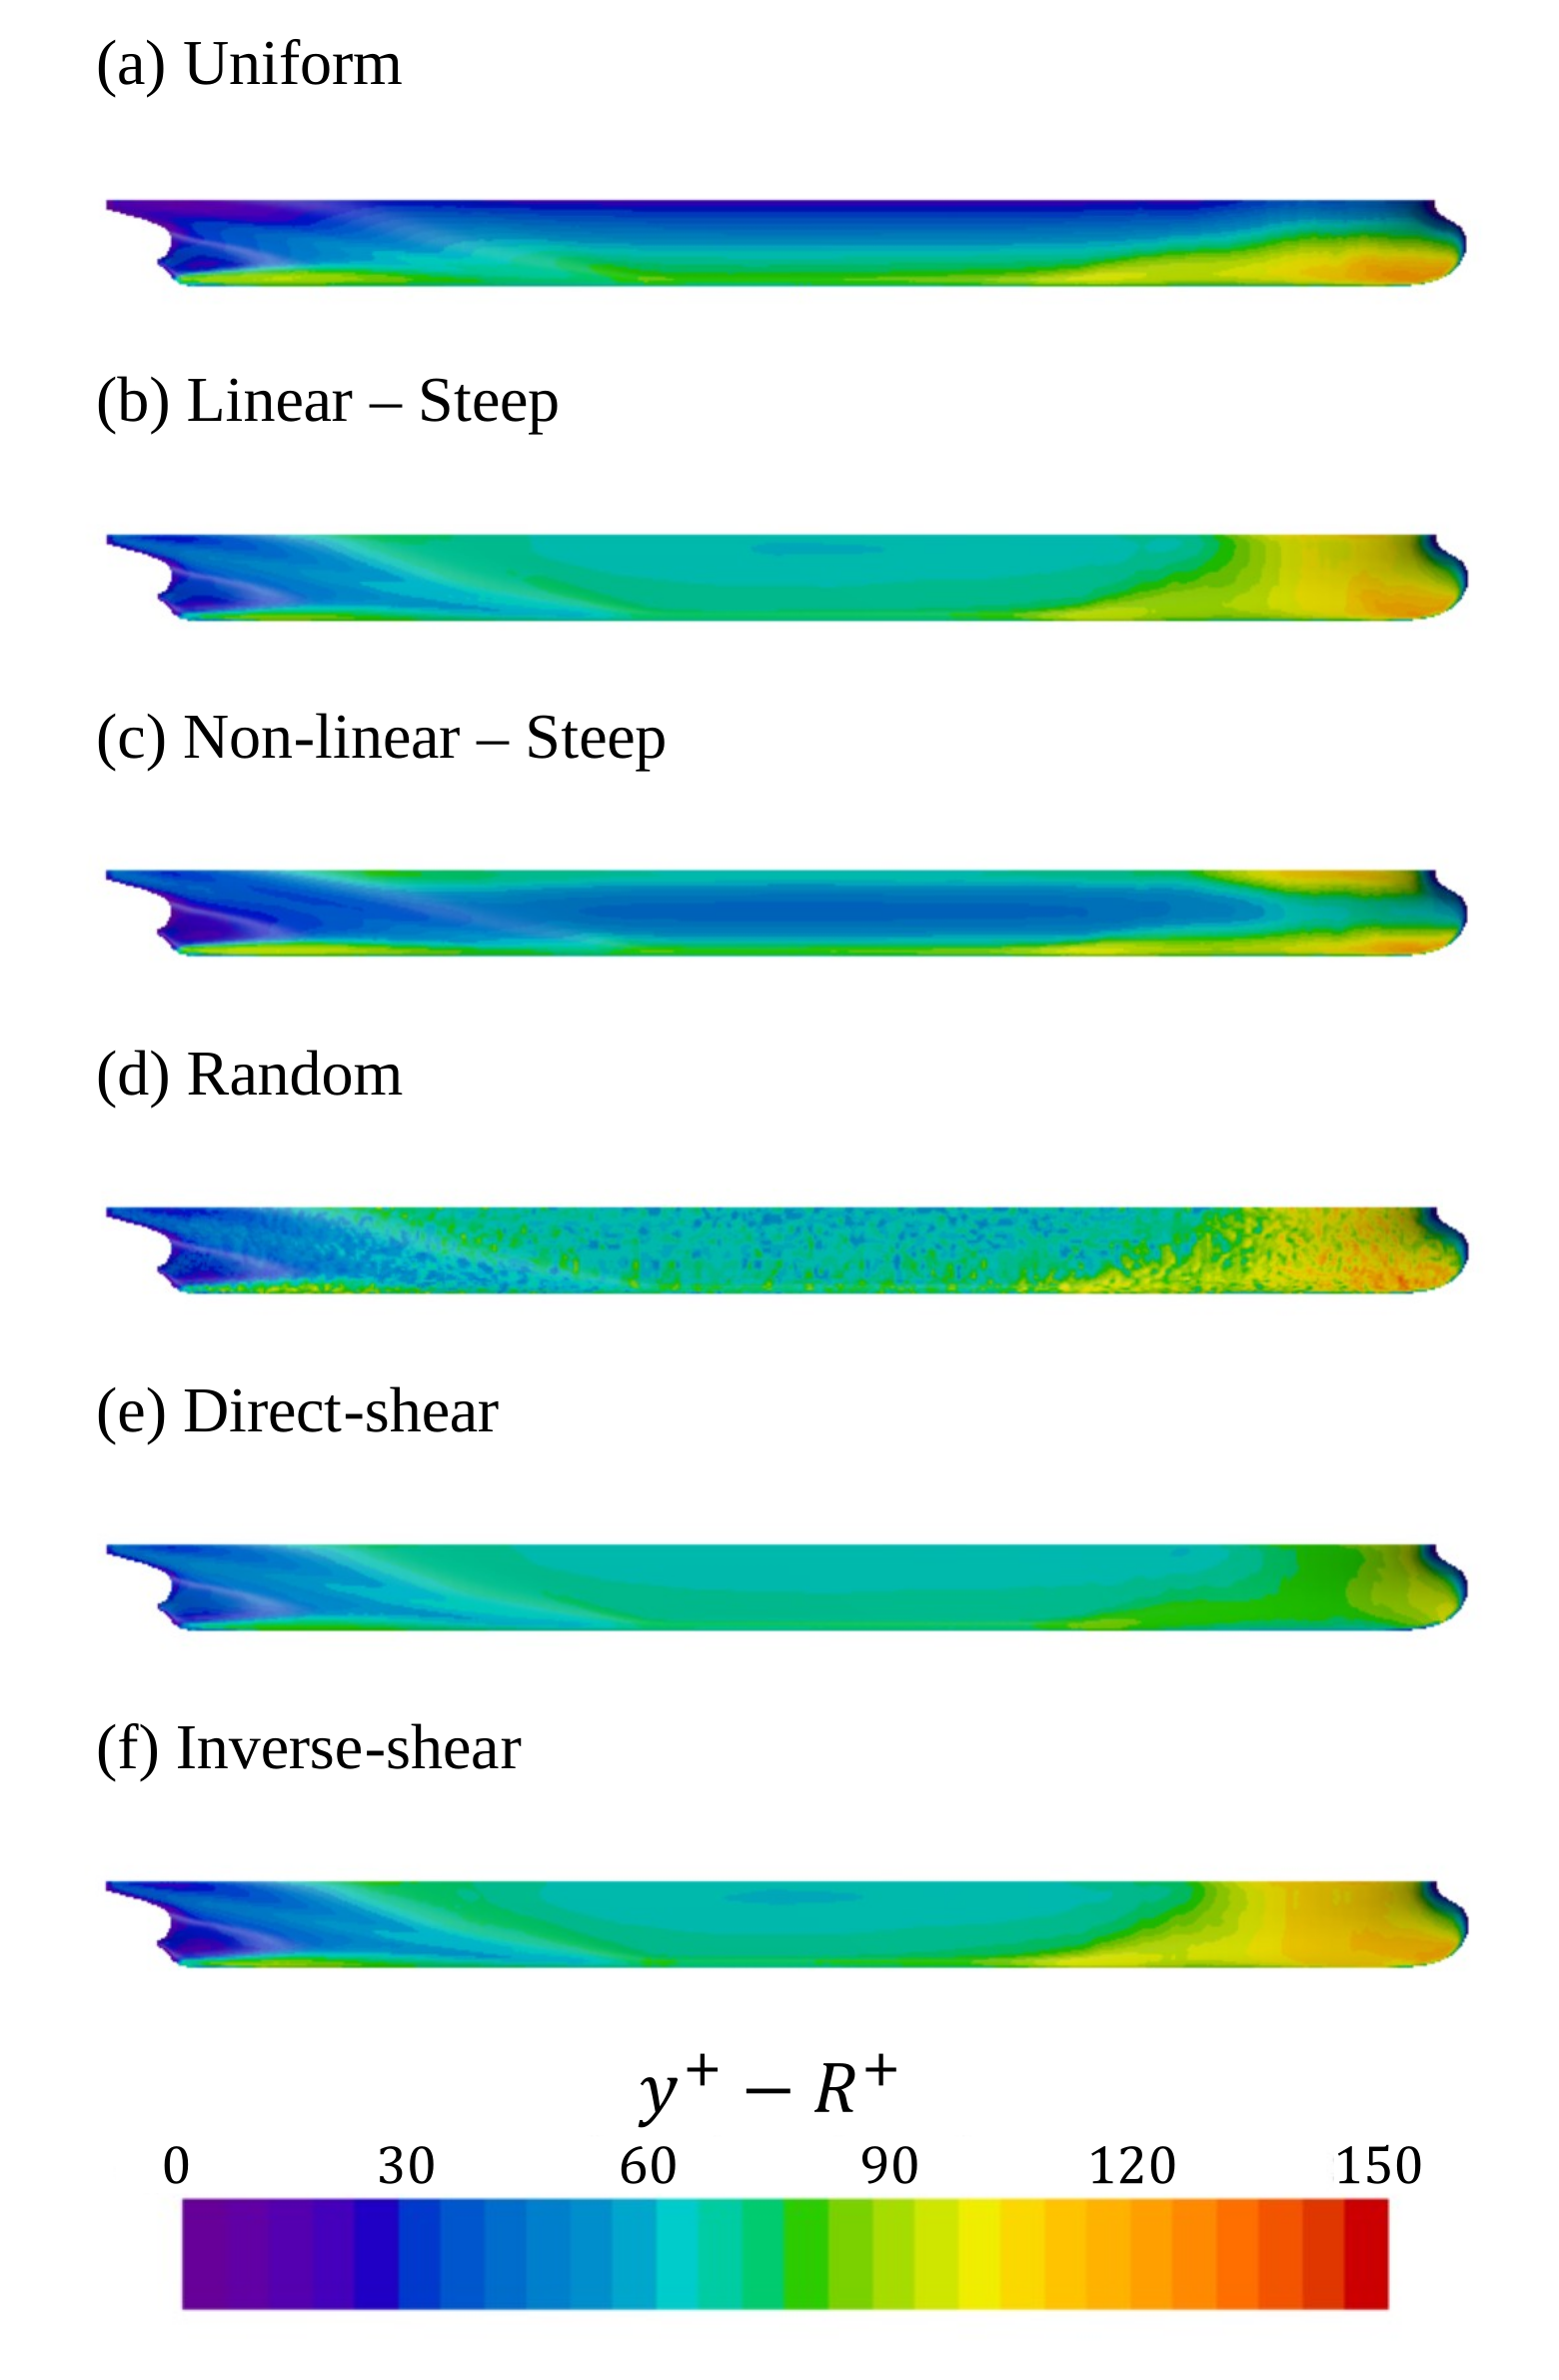
Figure 1.
Distribution of
y+ − R+
over the wetted hull surface of the KVLCC2 for representative roughness cases.
From top to bottom: (a) uniform, (b) linear–steep, (c) non-linear–steep,
(d) random, (e) direct-shear, and (f) inverse-shear stress-based cases.
This figure verifies the near-wall resolution used for the roughness modelling on the
KVLCC2 hull. Representative uniform, gradient-based, random, and shear-stress-based
roughness cases are shown to illustrate that the wall-function treatment remains
consistent across the main roughness-distribution strategies considered in the study.
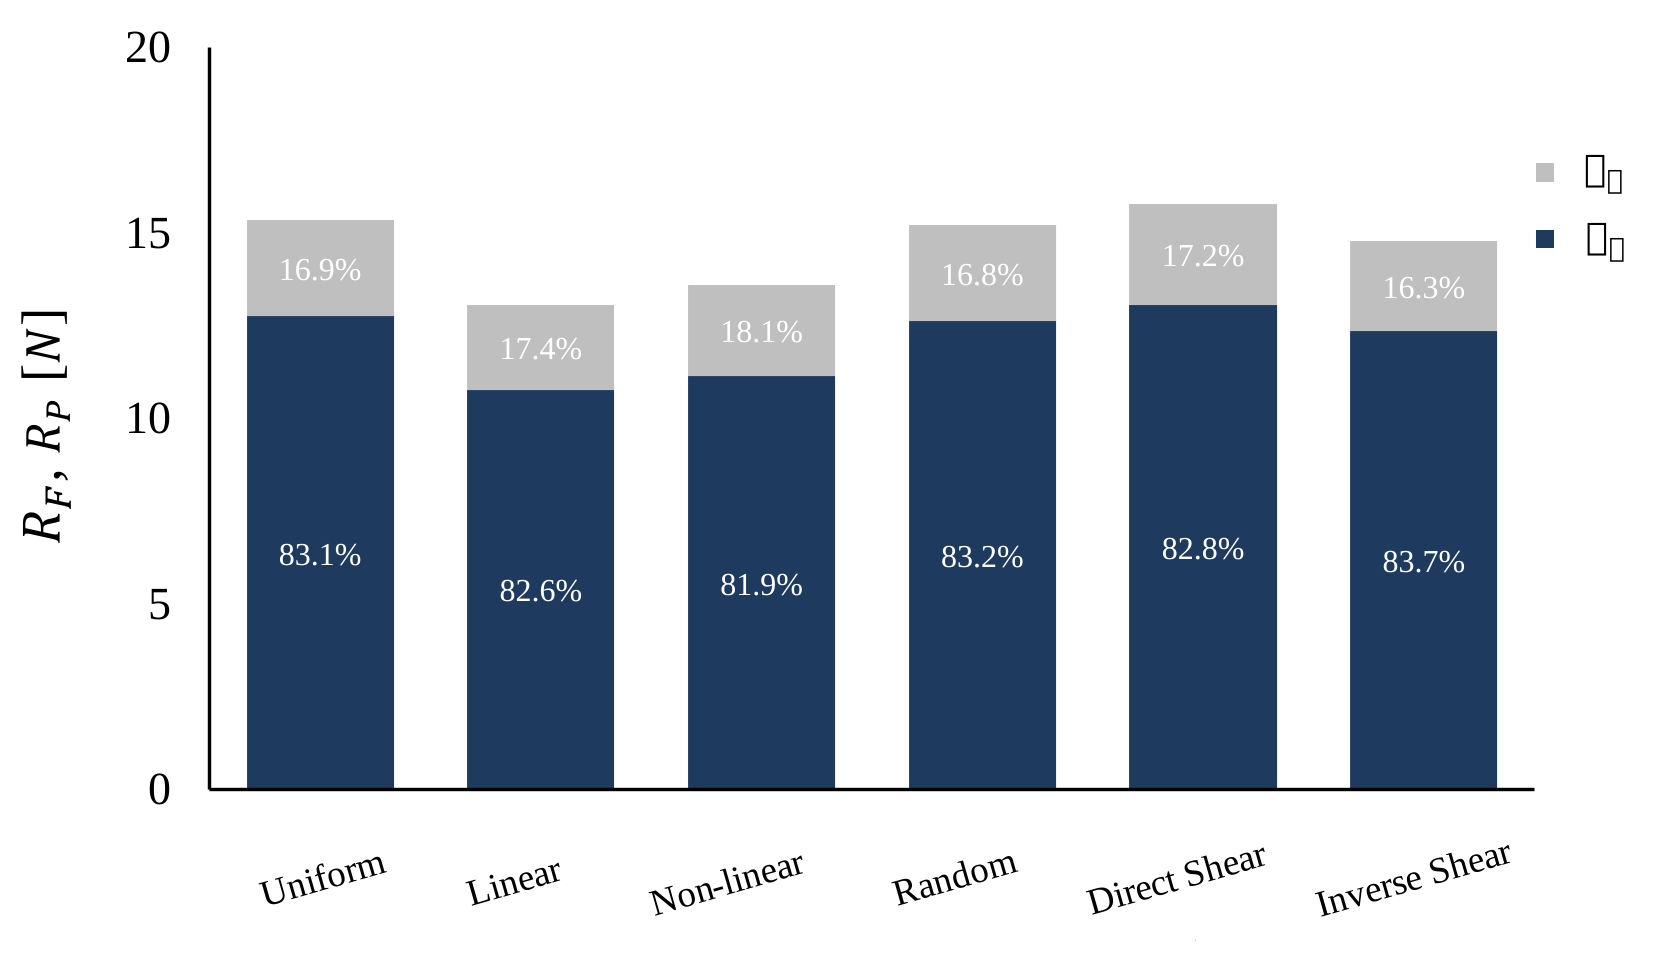
Figure 2.
Decomposition of total resistance into frictional and pressure components for the
KVLCC2 hull under the B20% reference-equivalent roughness severity.
The resistance decomposition shows that frictional resistance remains the dominant
contribution to total resistance for the roughened KVLCC2 hull, while the pressure
component still plays a non-negligible role. The comparison across roughness
distributions helps explain why the fuller KVLCC2 hull exhibits stronger sensitivity
to spatial roughness redistribution than the KCS hull.
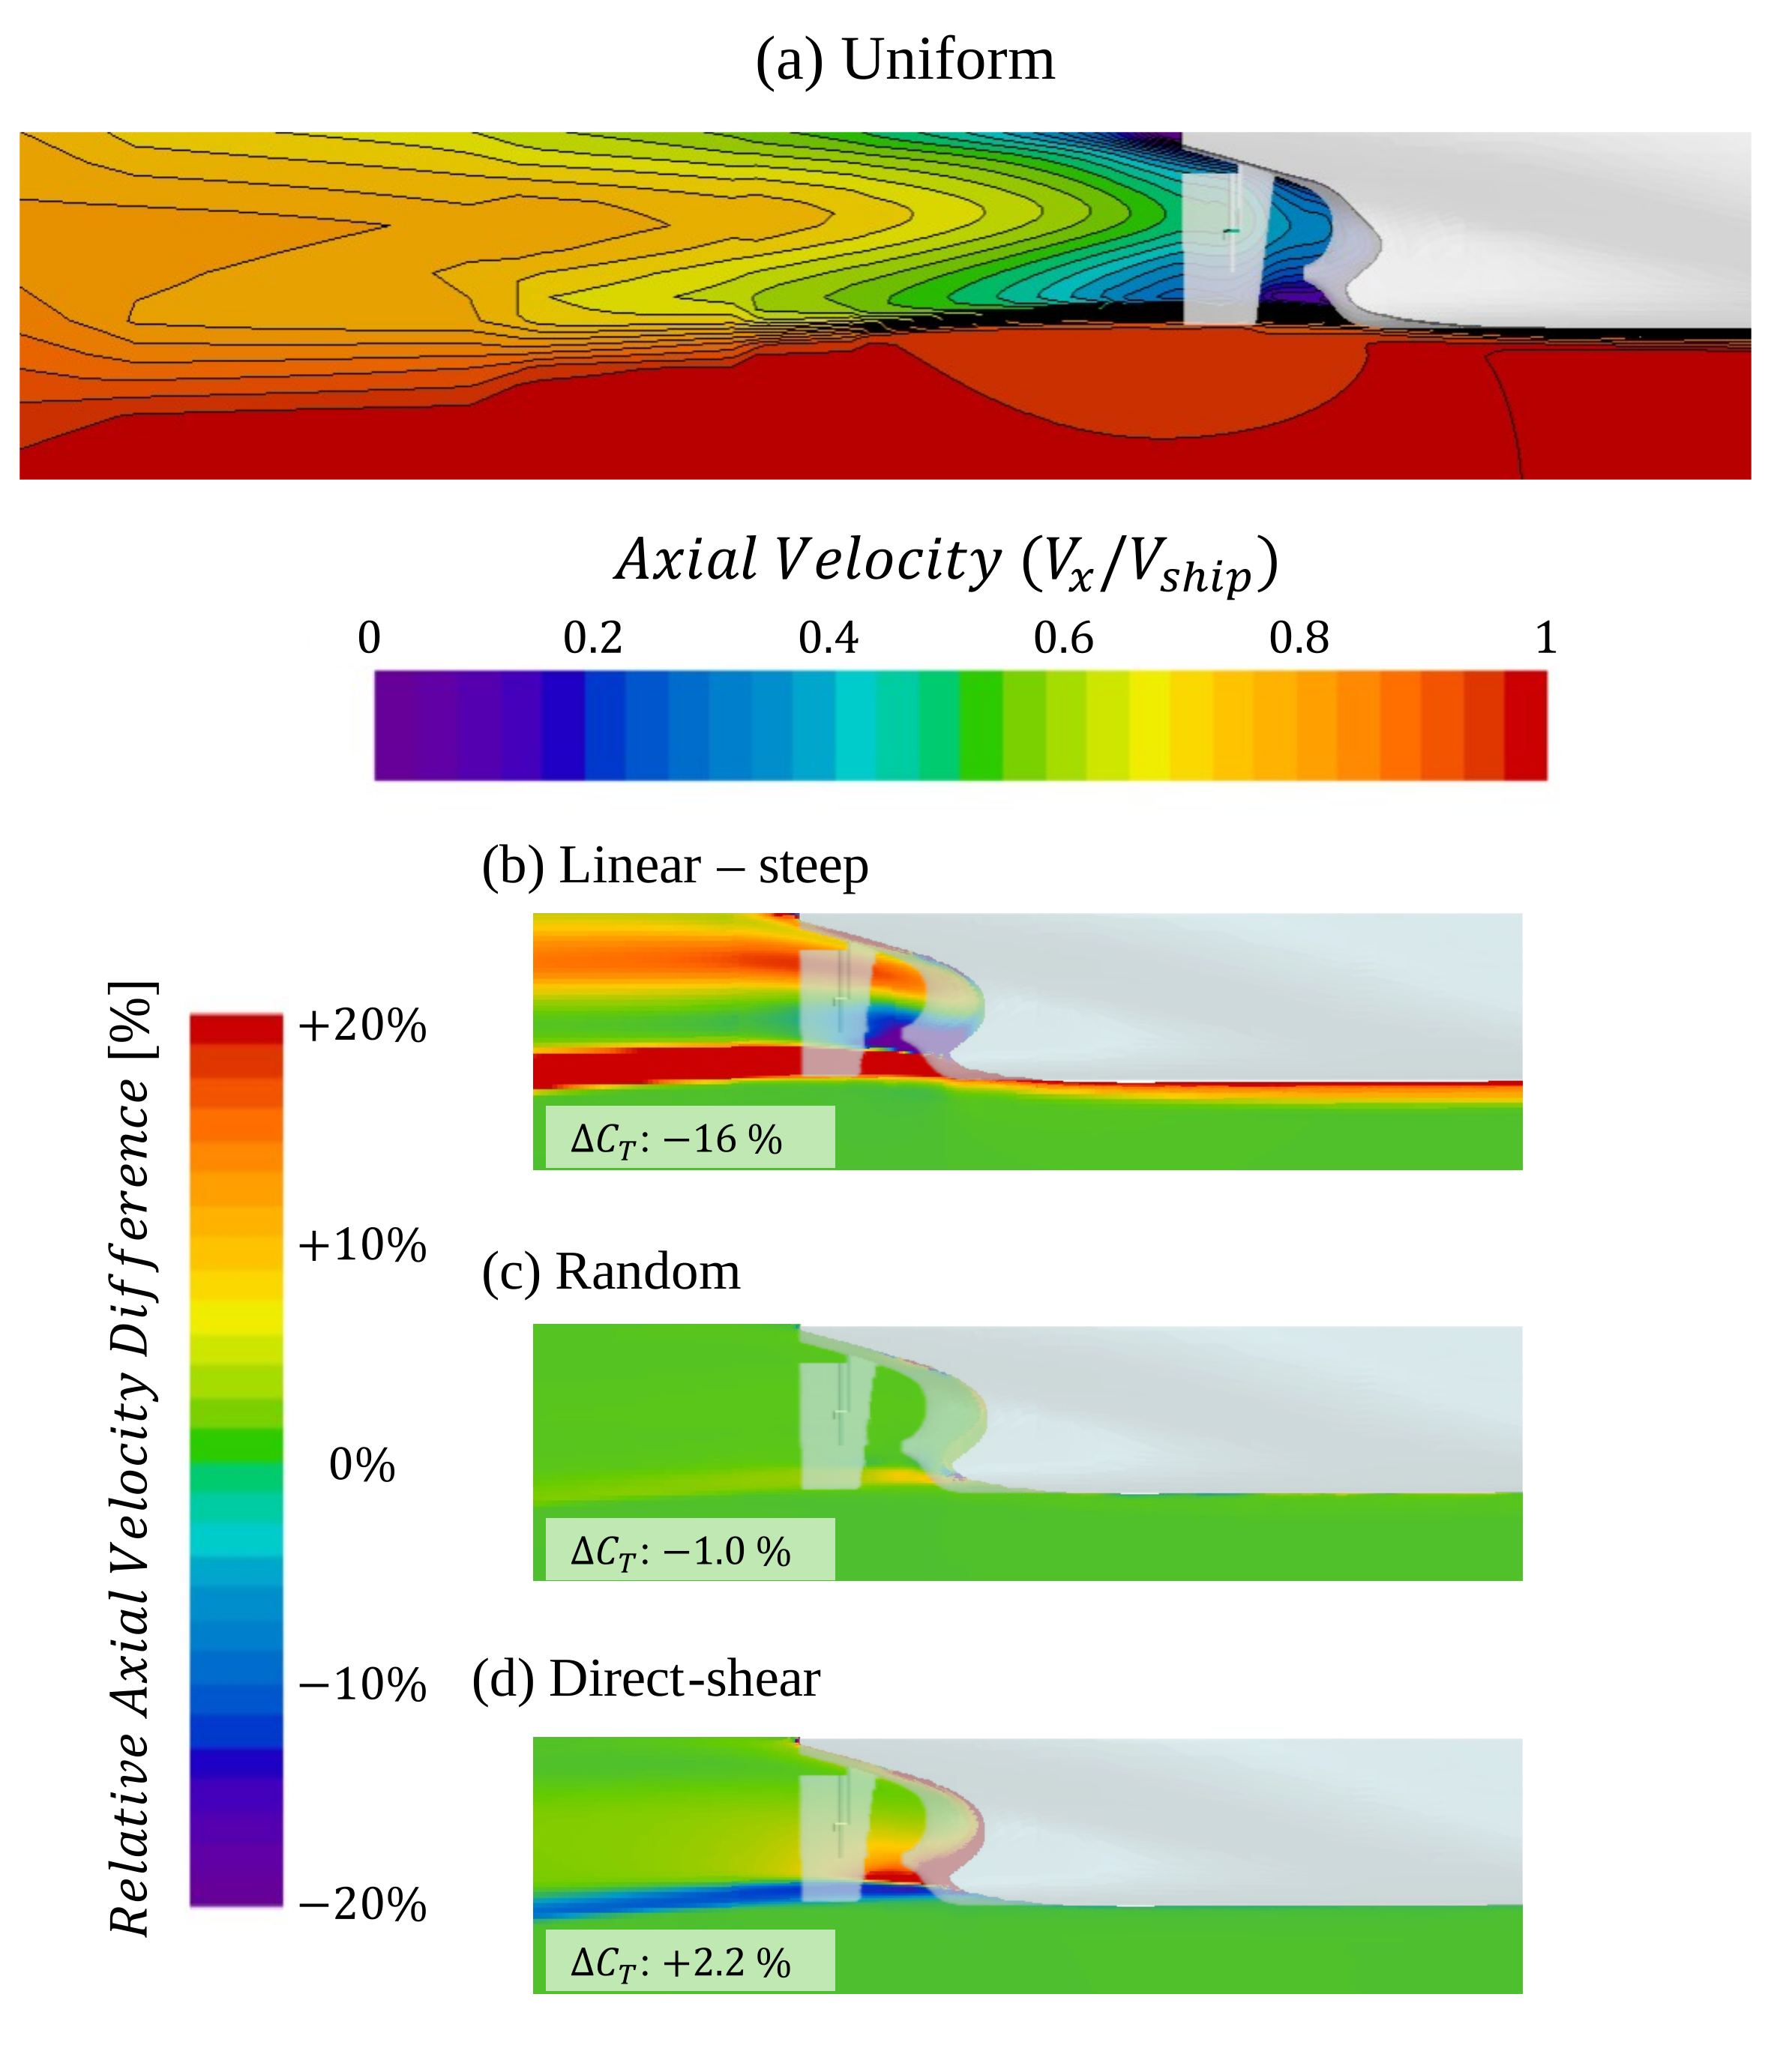
Figure 3.
Axial velocity
(Vx/Vship)
field and relative axial velocity deviations around the
KVLCC2 hull, extracted at
y = 0.006Lpp.
Panel (a) shows the uniformly roughened reference case. Panels (b)–(d) show
relative axial velocity deviations from the uniform reference for the linear–steep,
random, and direct-shear stress-based distributions, respectively. The figure
illustrates how different spatial roughness distributions modify wake development
around the KVLCC2 hull, with the linear–steep case showing faster wake recovery,
the random case remaining relatively close to the uniform reference, and the
direct-shear case producing more localised deviations near the stern and wake region.