Beyond uniform roughness: Spatial variability of hull roughness and implications for single-parameter
representation
Ocean Engineering (2026)
Sang-seok Han1, 2
1
Department of Naval Architecture, Ocean and Marine Engineering, University of Strathclyde, the United Kingdom
2
Research Institute of Marine Systems Engineering, Seoul National University, Republic of Korea
Abstract
Hull surface roughness plays a critical role in determining ship resistance. In current practice, ship resistance
prediction procedures of the International Towing Tank Conference (ITTC) commonly assume uniform roughness,
represented by a globally applied equivalent roughness parameter. This study examines the implications of this
assumption when spatially non-uniform roughness is present.
A review and structured synthesis of ITTC documents (1933–2024) indicate that hull surface roughness has been
consistently represented by a globally applied parameter in resistance prediction procedures. This suggests that
the uniform roughness assumption functions as a procedural abstraction within the established framework.
To investigate its physical implications, model-scale Computational Fluid Dynamics (CFD) simulations are performed
under controlled roughness conditions using two benchmark hull forms: the KRISO Container Ship (KCS) and the KRISO
Very Large Crude Carrier 2 (KVLCC2). Spatial roughness distributions—including linear (steep, mild, and reverse),
random, and wall shear stress-based configurations—are considered under a constant area-averaged equivalent
roughness height.
The results show that total resistance is sensitive to the spatial distribution of roughness even when the
area-averaged equivalent roughness height is identical. This trend is consistently observed across both hull forms
and roughness distribution types. Under the most severe roughness condition, deviations in the total resistance
coefficient (CT) reach approximately 12% for the KCS and 16% for the KVLCC2 relative to the
uniform roughness baseline. These differences are primarily
associated
with variations in frictional response, together with changes in boundary layer development and wake recovery
behaviour.
The findings indicate that, under spatially non-uniform roughness, resistance cannot be fully characterised by
area-averaged roughness alone. Together with the ITTC document review, the results support interpreting the
equivalent roughness parameter as a procedural abstraction based on a uniform roughness assumption. This
representation captures the overall effect of roughness magnitude, but it does not fully describe resistance
behaviour when roughness varies spatially. The results do not question the validity of existing ITTC methods
within their intended scope; rather, they clarify the physical meaning and limitations of the uniform roughness
assumption. They also provide physical context for the use and limitations of single-parameter roughness
representation within the existing resistance prediction framework. Extension to full-scale conditions and more
realistic roughness representations remains a subject for future work.
Table 1.
Emergence and procedural consolidation of hull surface roughness
in ITTC documents (1933–1972).
Year
Committee/Group
Procedural Context
Roughness Representation
Spatial Variability
Scope/Limitation
1933
1st ICTS
Model experiments
Not specified
Not addressed
Model surface quality control only
1934
2nd ICTS
Skin friction discussion
Uniform roughness implied
Implicitly excluded
No formal procedural adoption
1935
3rd ICTS
Model experiments
Local artificial roughening
Not addressed
Experimental device only
1937
4th ICTS
Model experiments
Artificial grain-based roughness
Not explicitly addressed
Uniform grain-based parameter
1948
5th ICTS
Skin friction formulation
Uniform representation implied
Not explicitly addressed
Trial-based roughness allowance
1951
6th ICTS
Skin friction formulation
Uniform representation implied
Not explicitly addressed
Provisional roughness allowance
1954
7th ICTS
Skin friction formulation
Uniform representation implied
Not explicitly addressed
Correlation allowance framework
1957
8th ITTC
Resistance extrapolation
Explicitly uniform
Not explicitly addressed
Single roughness allowance applied
1960
9th ITTC
Resistance extrapolation
Explicitly uniform
Not explicitly addressed
Correlation roughness allowance
1963
RC (10th ITTC)
Turbulence stimulation
Discrete roughness elements
Not addressed
Model-scale turbulence control only
1966
RC (11th ITTC)
Resistance extrapolation
Implicitly uniform (procedural)
Not explicitly addressed
Roughness via procedural allowances
1969
PC (12th ITTC)
Trial-based measurements
Implicitly uniform (procedural)
Not addressed
Surface condition documentation only
1972
PC (13th ITTC)
Ship-model correlation
Explicitly uniform
Not explicitly addressed
Roughness identified as ongoing research issue
Note:
Early conferences appear under varying official titles in contemporary
proceedings. For clarity, all early meetings are referred to here using
the normalised designation International Conference of Tank
Superintendents (ICTS). Committee designations also vary across ITTC
periods, including changes in naming and scope. For consistency,
committees are referred to using standardised abbreviations
(e.g. RC and PC), irrespective of variations in official titles.
The descriptors summarise the documented treatment of hull surface
roughness during this period.
Table 2.
Evolution of hull surface roughness representation within ITTC
procedures (1975–2011).
Note:
Committee designations are standardised as RC (Resistance Committee),
PC (Performance Committee), SC (Specialist Committee), and RP
(Recommended Procedures and Guidelines), irrespective of minor
variations in official titles across different ITTC periods.
The terminology reflects the procedural context of the referenced
documents and serves as an interpretative summary rather than a literal
physical classification.
Table 3.
Recent advances in hull surface roughness modelling and spatial
considerations within ITTC documents (2014–2024).
Note:
The terminology used in this table summarises the procedural treatment
of hull surface roughness in the referenced ITTC documents and does not
imply a physical classification of surface condition.
Selected Figures
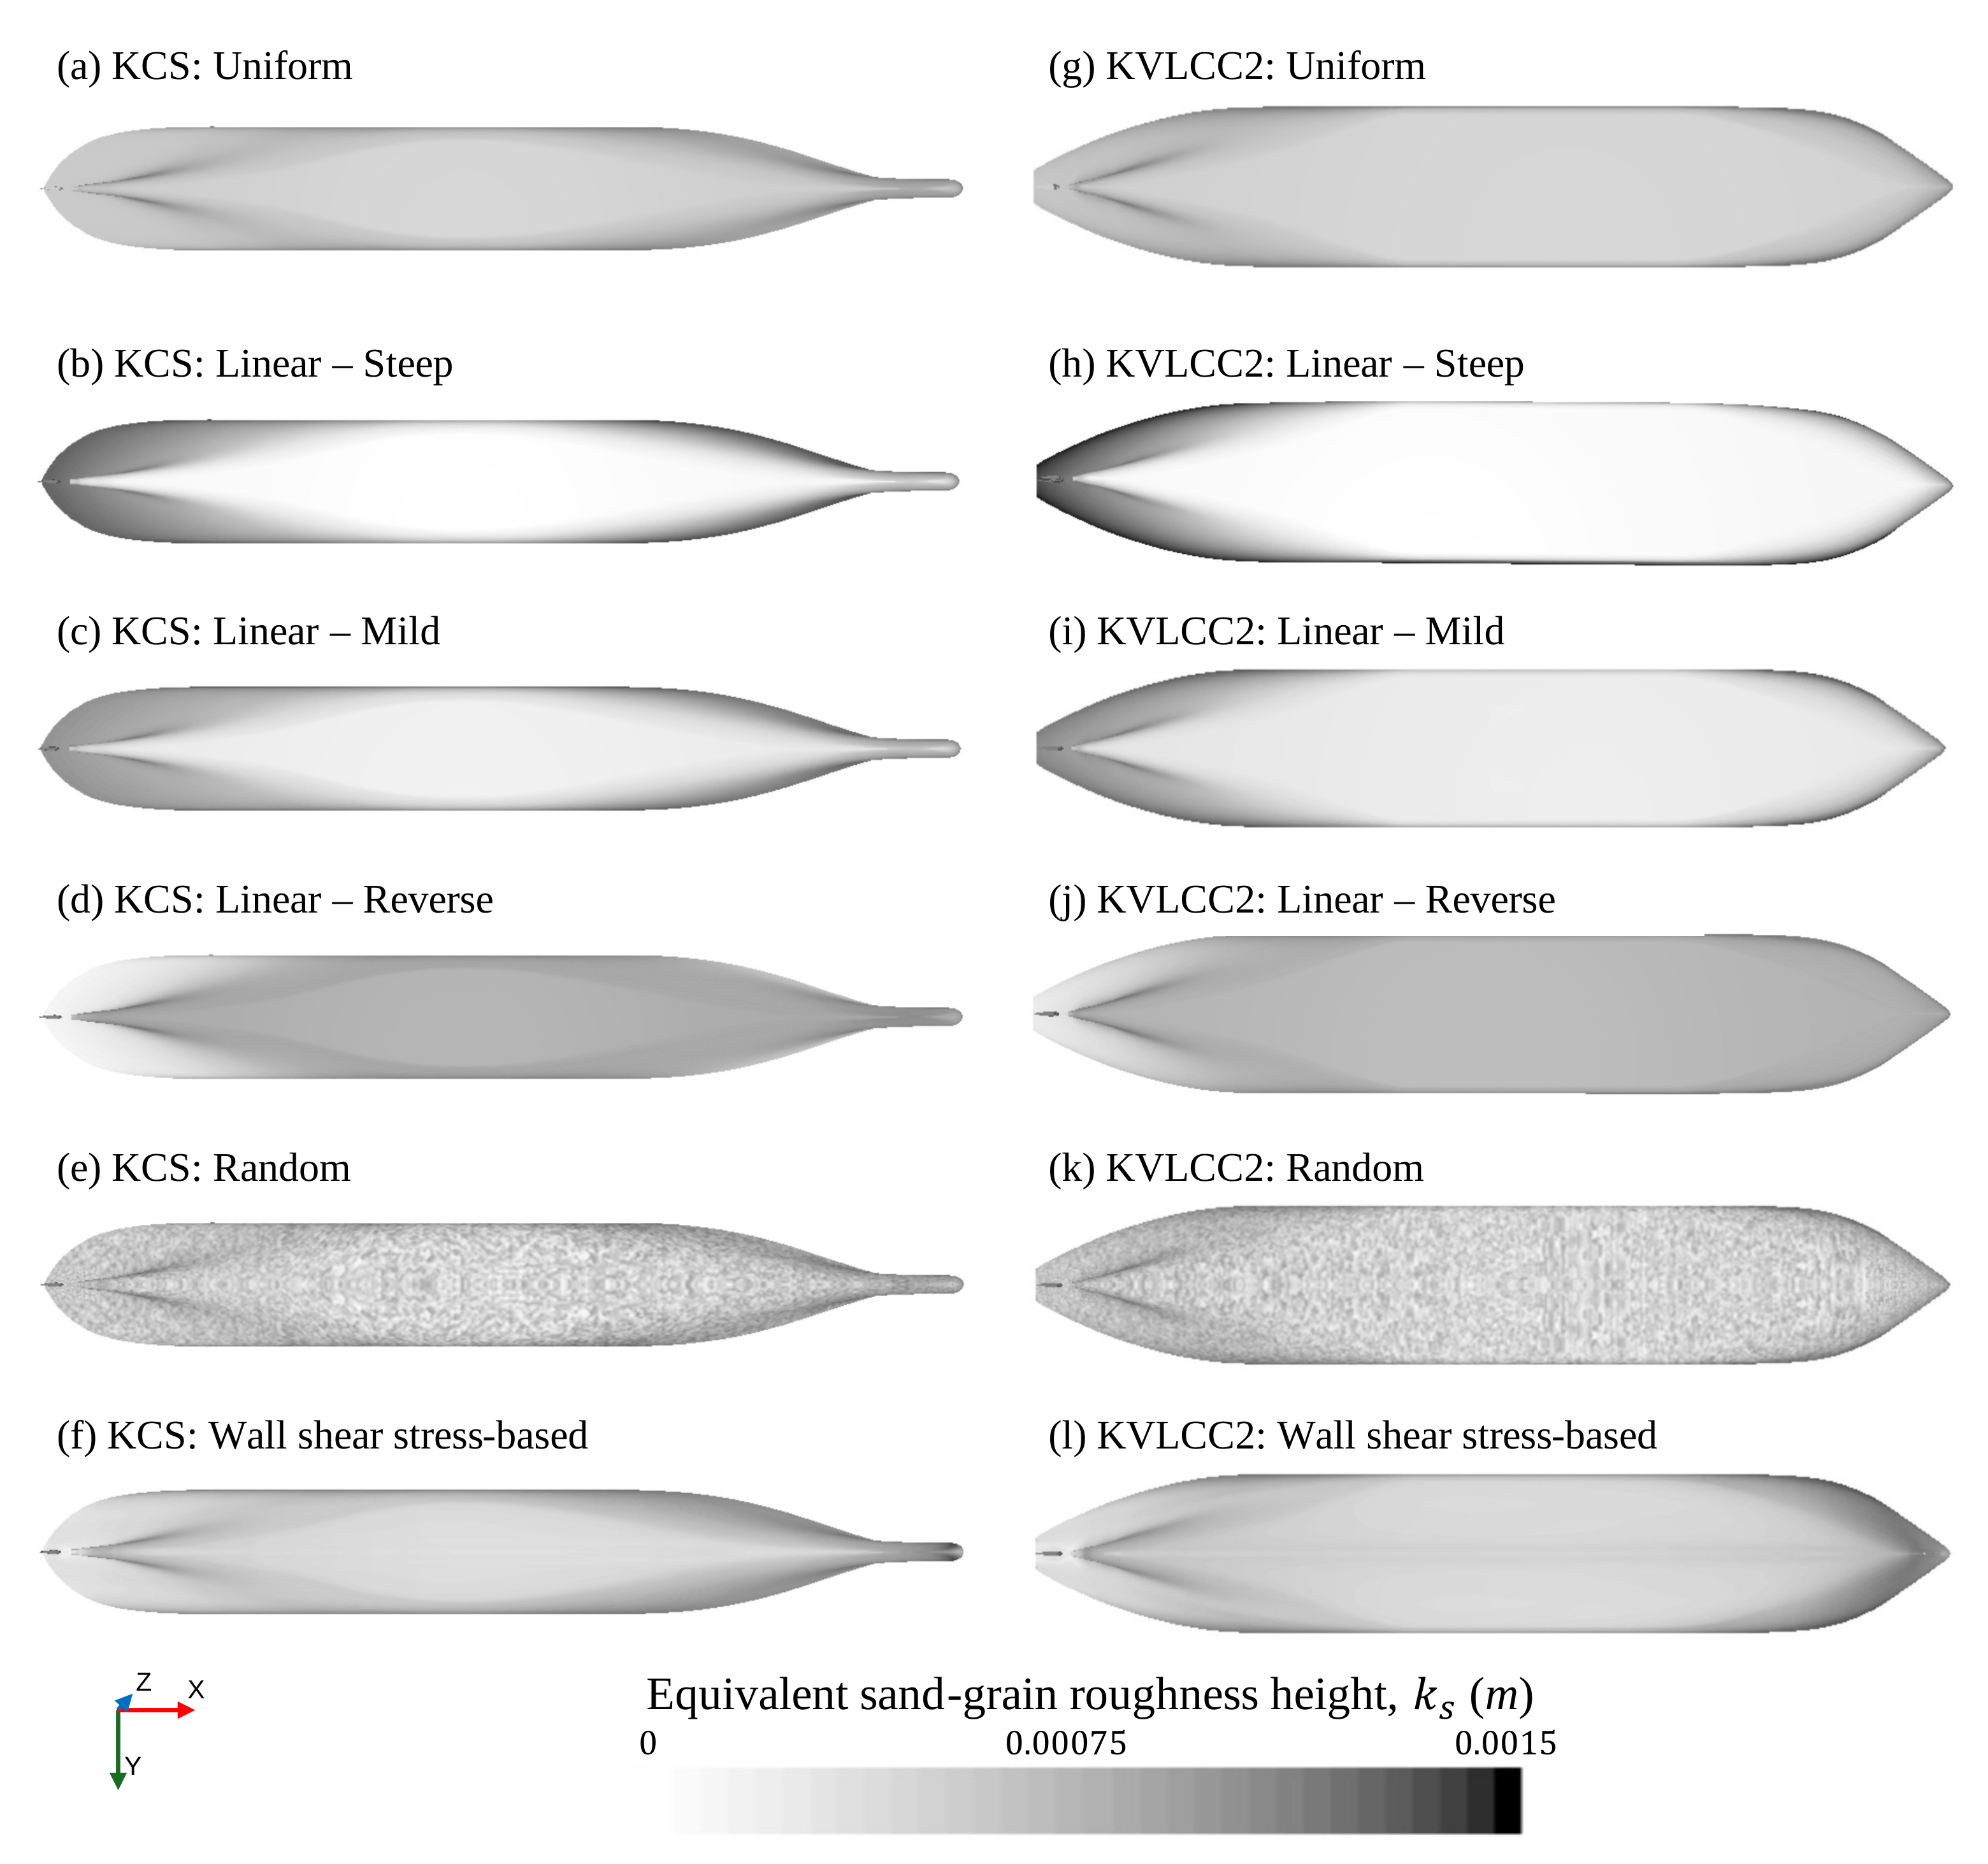
Figure 1. Bottom-view spatial roughness distributions for the KCS and KVLCC2 hulls under the
B20% severity level.
The figure compares the representative spatial roughness distributions applied to the
KRISO Container Ship (KCS) and KRISO Very Large Crude Carrier 2 (KVLCC2) hulls.
The cases correspond to uniform, linear–steep, linear–mild, linear–reverse, random,
and wall shear stress-based distributions, respectively. All cases preserve the same
area-averaged equivalent sand-grain roughness height, allowing the effect of spatial
variability to be isolated. The bottom-view presentation clarifies how the imposed
roughness fields extend over the flat-bottom region of each hull.
(a) KCS hull
(b) KVLCC2 hull
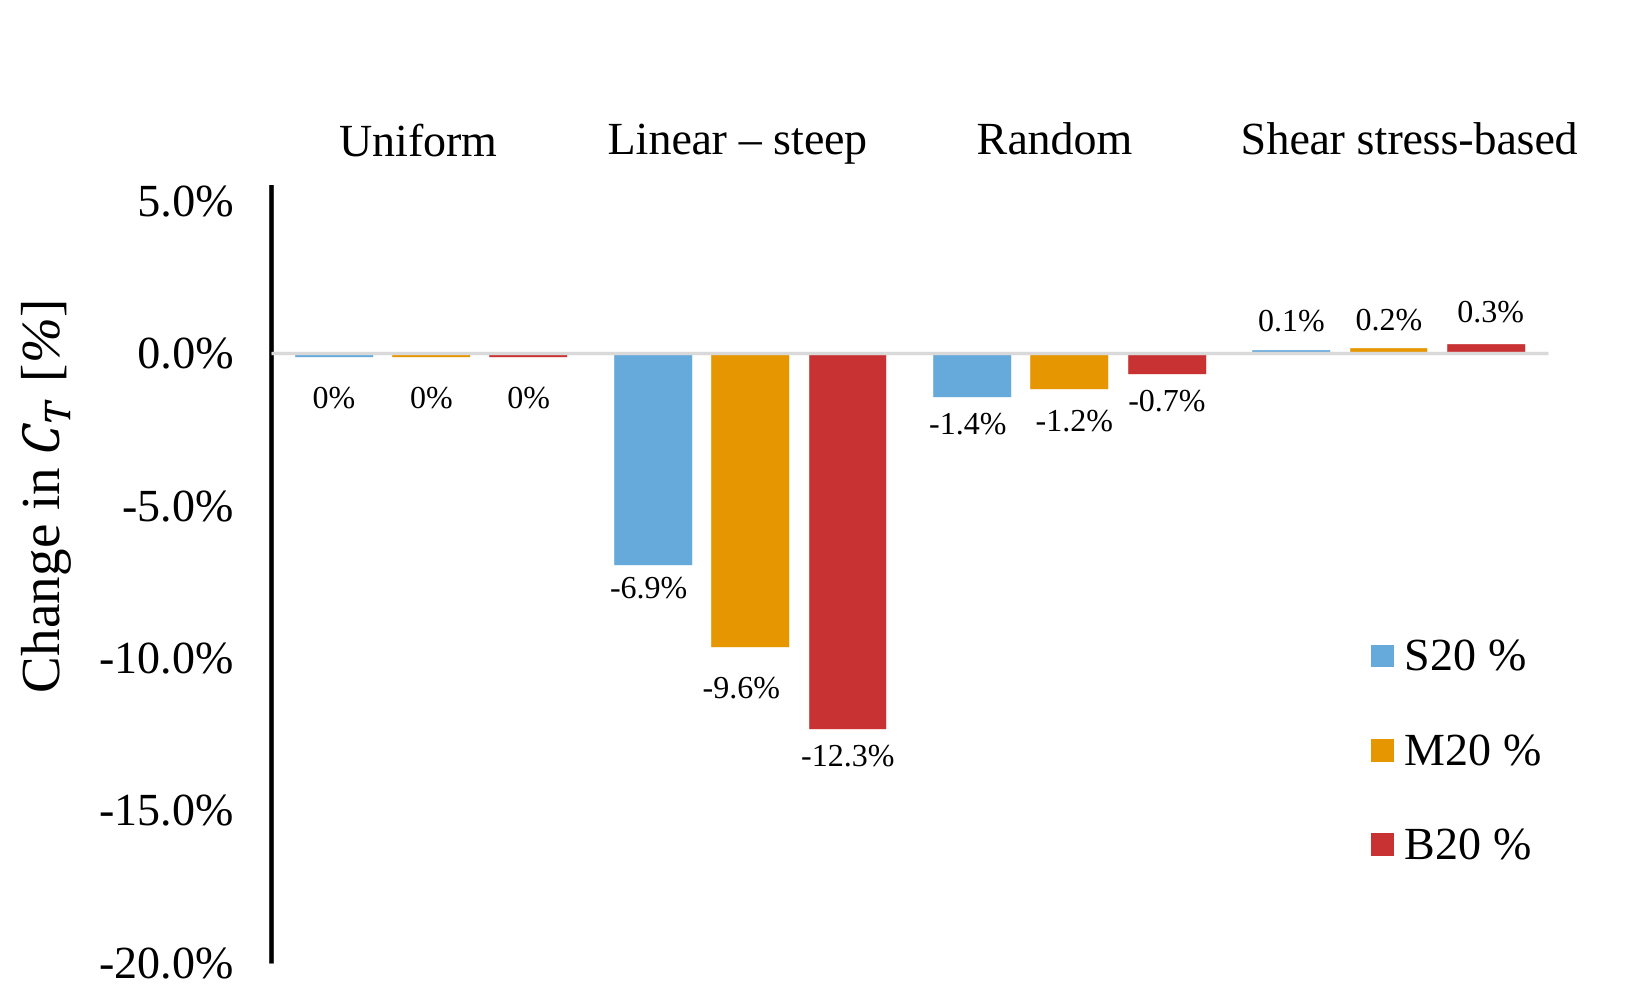
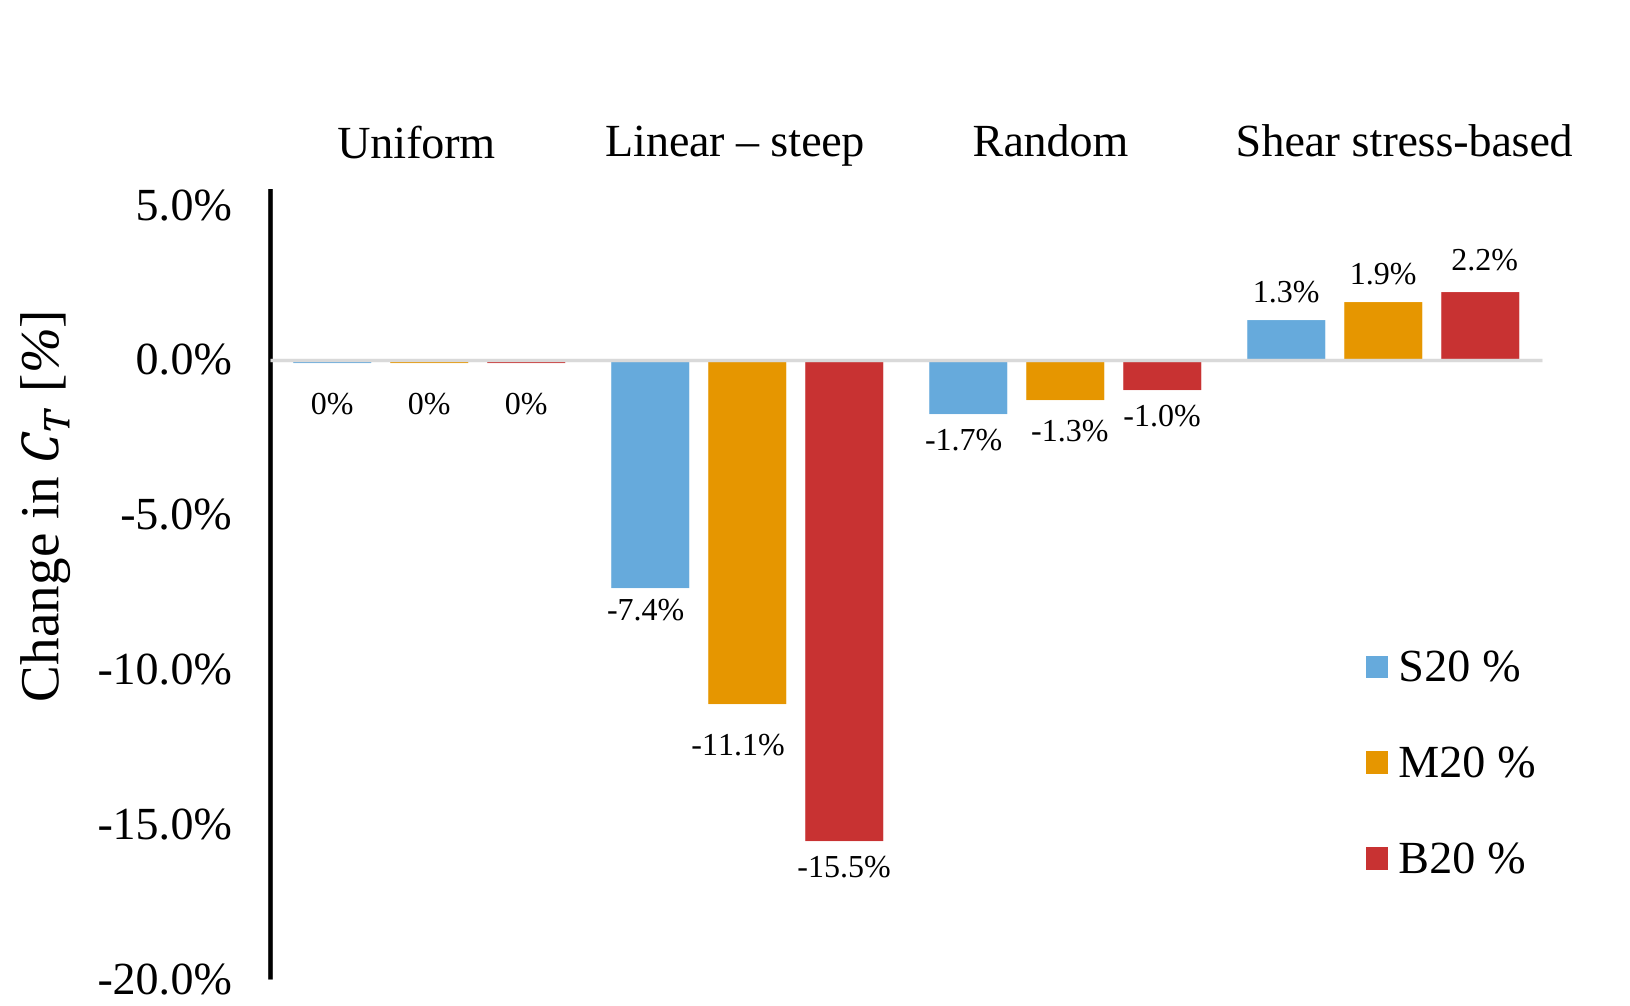
Figure 2. Relative change in total resistance coefficient, CT, for the KCS
and KVLCC2 hulls under different spatial roughness distributions and fouling severities.
The figure compares the relative change in the total resistance coefficient
(CT) with respect to the uniform roughness baseline
for the KCS and KVLCC2 hulls. Results are shown for four representative spatial
roughness distributions—uniform, linear–steep, random, and wall shear stress-based—
under three fouling severity levels (S20%, M20%, and B20%). For both hull forms,
the linear–steep distribution produces the largest reduction relative to the uniform
case, whereas the random distribution remains close to the baseline. The shear
stress-based distribution has only a minor effect for the KCS, but produces a small
increase in CT for the KVLCC2.
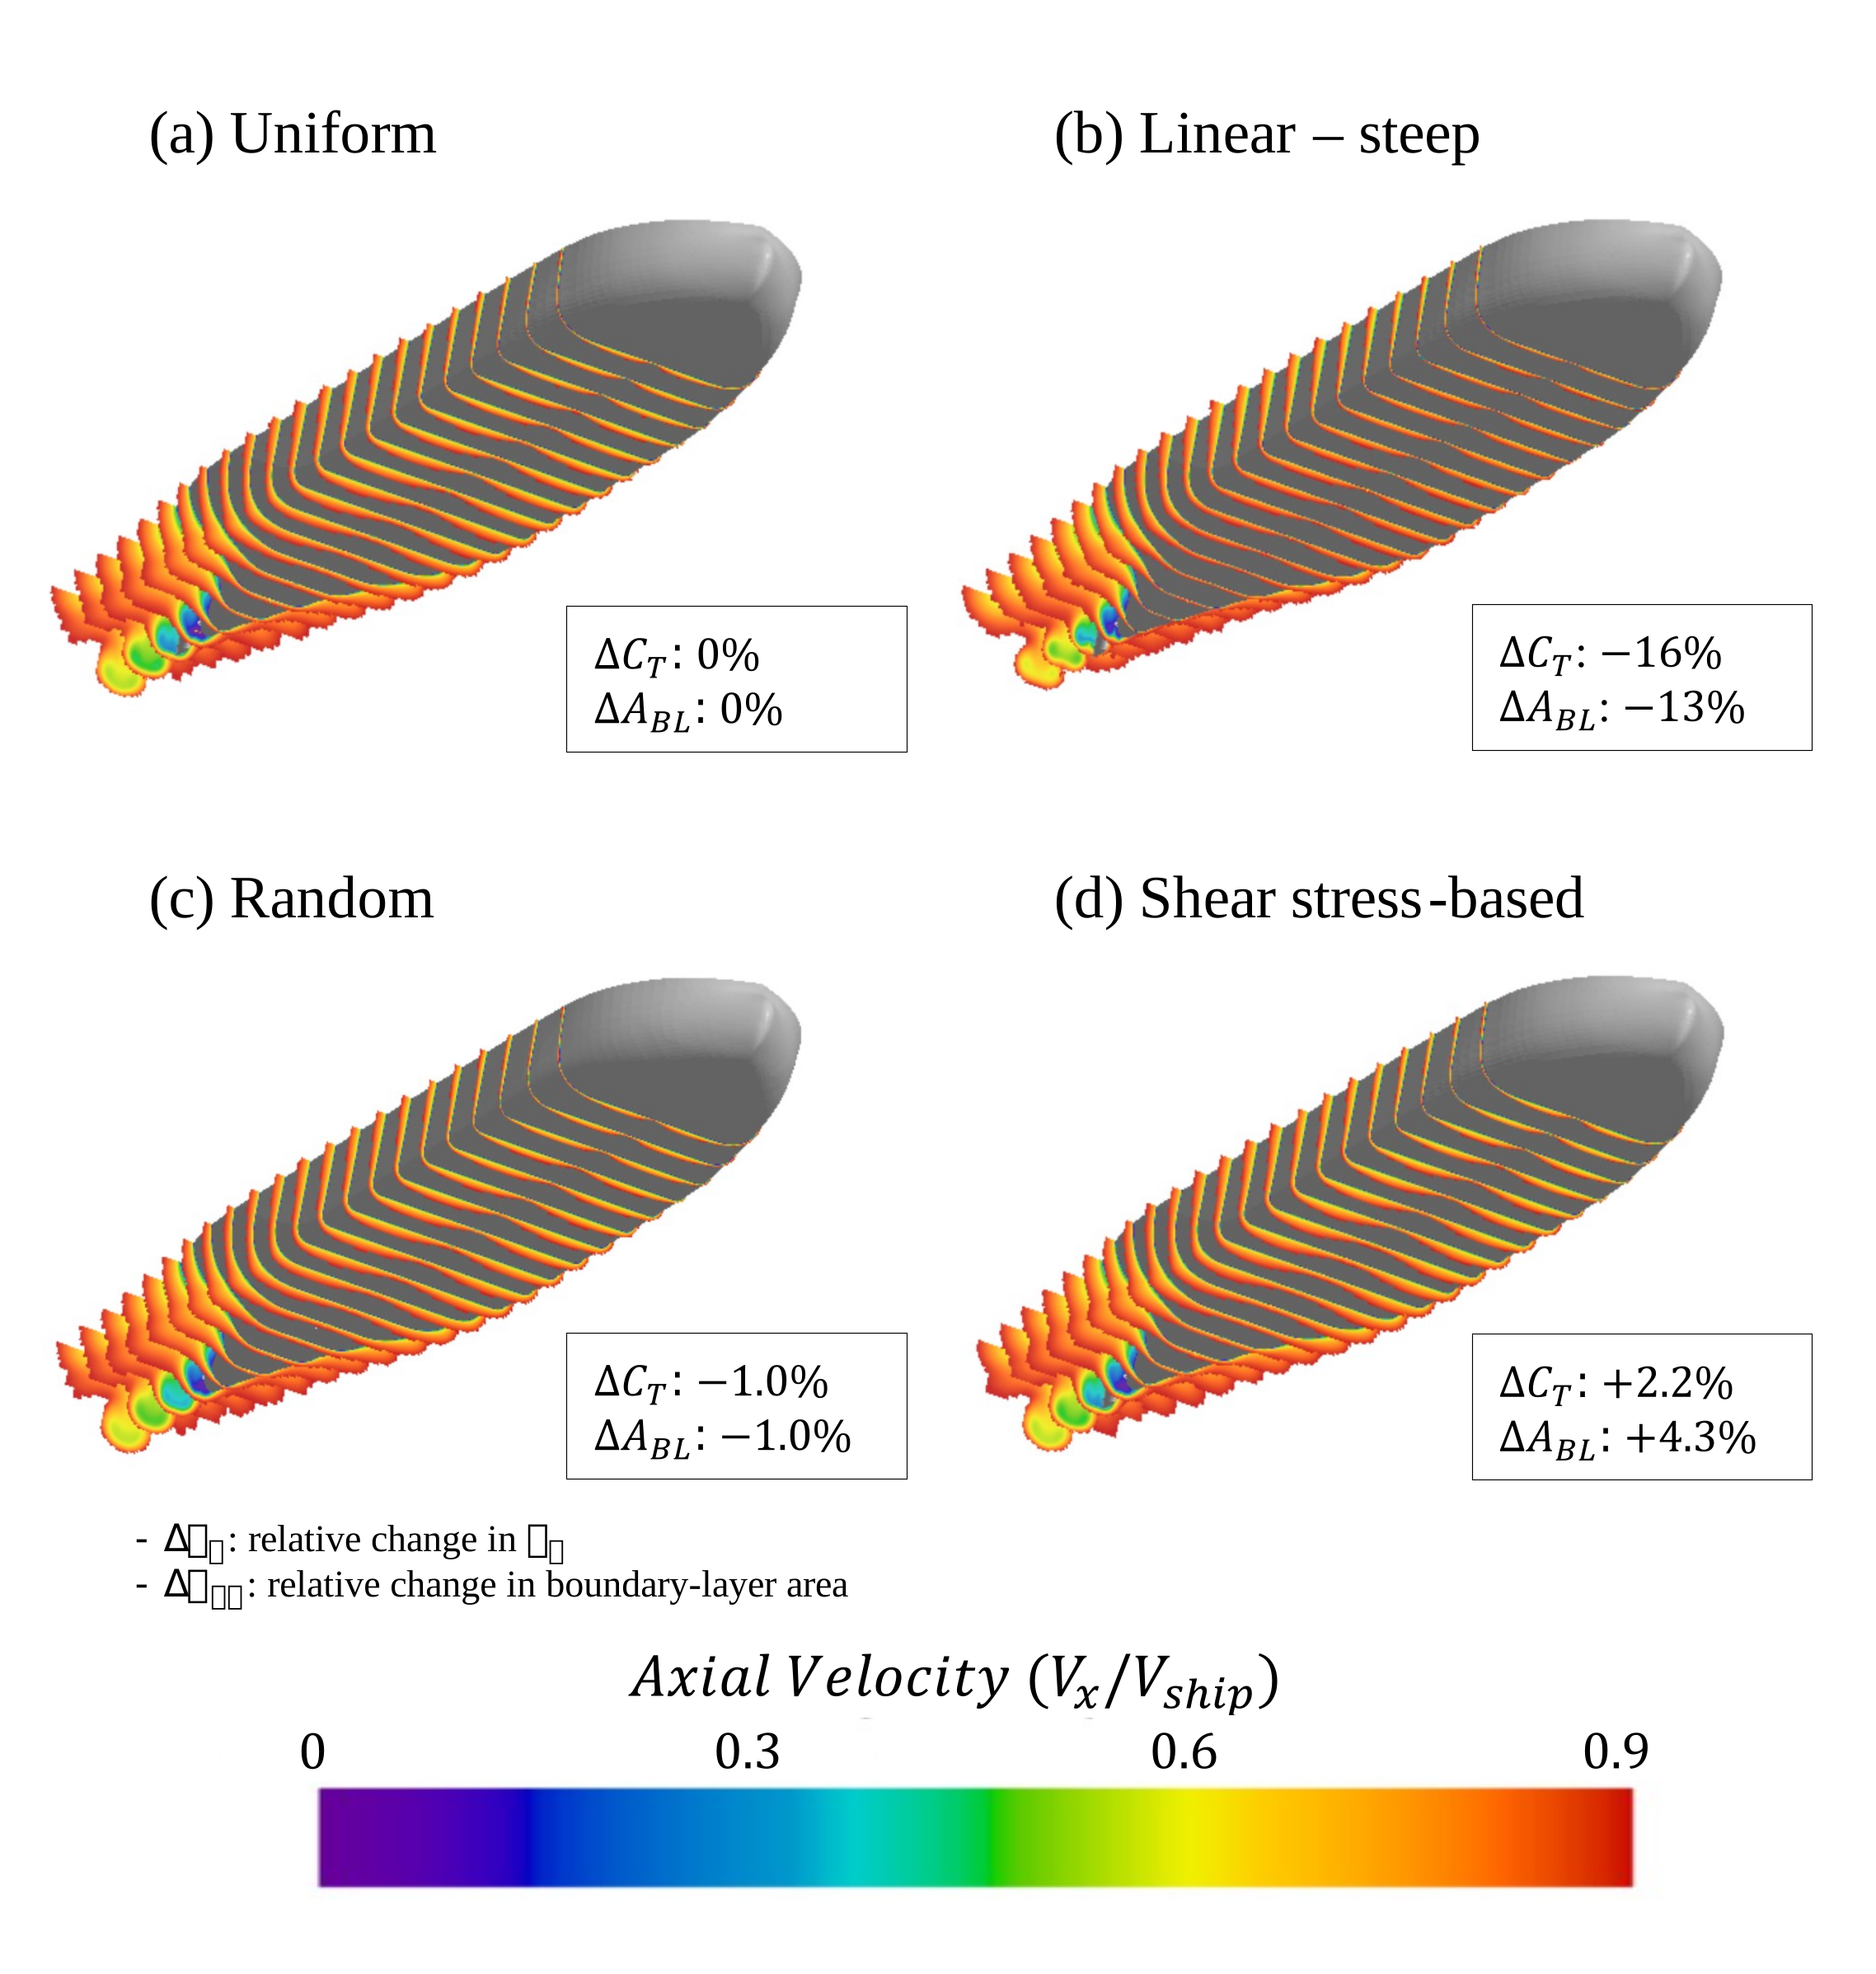
Figure 3. Boundary layer development along the KVLCC2 hull, visualised through axial velocity
slices, under different spatial roughness distributions at the B20% severity level.
The figure compares boundary-layer development along the KVLCC2 hull for four representative
spatial roughness distributions: uniform, linear–steep, random, and wall shear stress-based.
The annotations show the relative changes in the total resistance coefficient
(ΔCT) and boundary-layer area
(ΔABL) with respect to the uniform baseline.
The linear–steep distribution produces the largest reductions in both quantities,
whereas the random case remains close to the uniform reference. In contrast, the
wall shear stress-based distribution increases both the boundary-layer area and
total resistance, indicating delayed near-wall flow recovery.